
Maria Chojnowska
23 August 2023, 5 min read

What's inside
- Data Insights and Visualization: An Inseparable Duo
- Unveiling Information: How Data Visualization Enhances Accessibility
- The Art of Communicating Insights Through Data Visualization
- Conclusion
- TL;DR
Data has become an invaluable resource in our current age, touching every aspect of our lives, from business to social interaction. With the rising flood of information, deciphering this data and communicating its insights effectively is more critical than ever.
Continuing our previous exploration of "Data Visualization in Python, Part 1: Cellular Automata", we now dive deeper into data visualization, discussing its crucial role in rendering complex data insights accessible and intelligible.
Data Insights and Visualization: An Inseparable Duo
In the data universe, insights are like nuggets of gold. They are valuable findings obtained through data analysis, forming the foundation for informed decision-making across various sectors.
However, these insights are only as beneficial as our ability to interpret and convey them. This is where data visualization steps in, converting raw data into visual formats like charts, graphs, and maps. These formats enable a more efficient understanding of our data's patterns, trends, and outliers in our data. Therefore, data visualization essentially translates complex data insights into more palpable forms that can be easily understood and acted upon.
Unveiling Information: How Data Visualization Enhances Accessibility
Data visualizations serve as a vital bridge between complex data and those who need to grasp it. By transforming rows and columns of abstract numbers into visuals, data suddenly becomes more engaging, digestible, and, thus, more accessible.
Consider a dense spreadsheet of global population data. Without a background in data analysis, most people would find it difficult to interpret. However, transform this data into a simple bar chart or a colorful map, and trends and disparities become apparent. This visual format breaks down the barriers of technical jargon and data literacy, enabling a broader audience to understand the narrative the data tells.
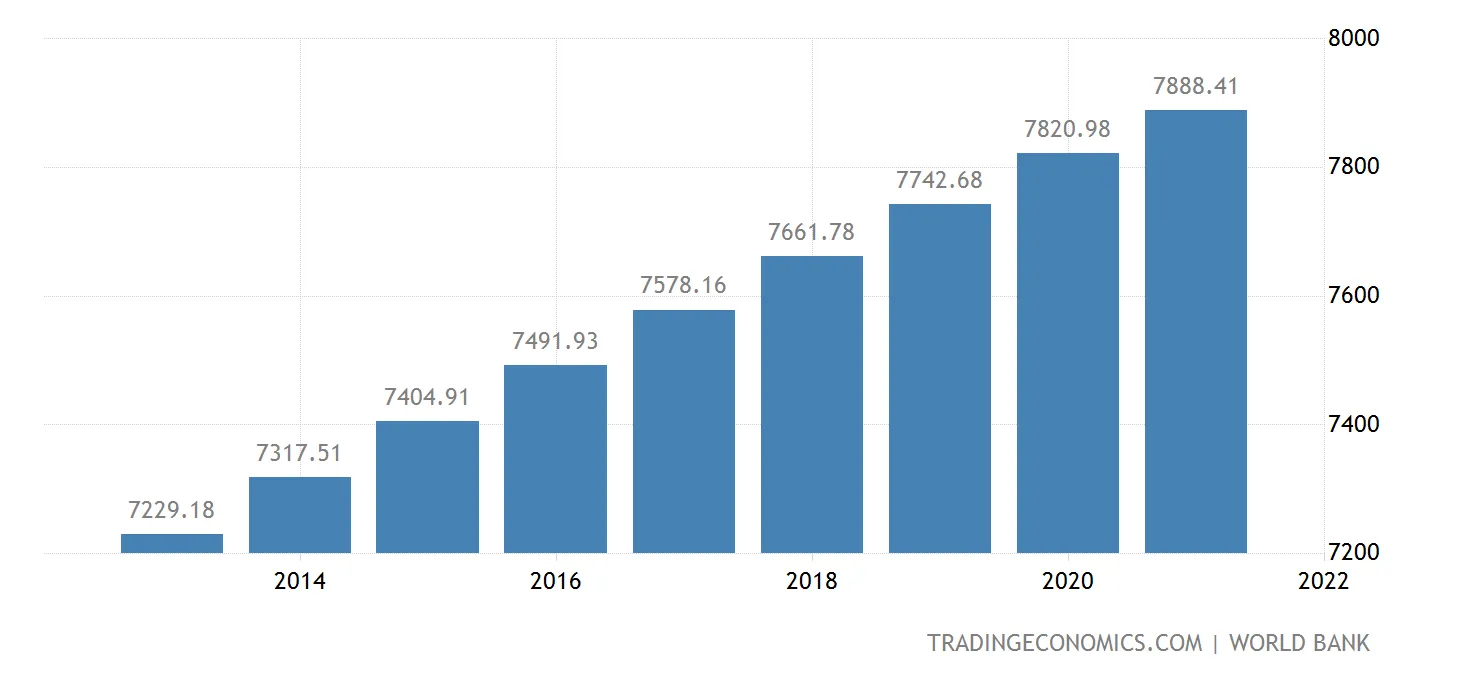
Furthermore, data visualization isn't static but has evolved into a more dynamic form. With the advent of interactive visualizations, users can now engage directly with the data, delving into specific segments or periods for more personalized insights. This promotes a more profound understanding of the data and enhances user engagement and information retention.
The Art of Communicating Insights Through Data Visualization
Effective data visualization balances art and science. It isn't merely about converting numbers into graphics but doing so in a manner that communicates the desired message and story. Here are a few strategies for crafting impactful data visualizations:
- Clarity: The first rule of effective data visualization is simplicity. Avoid excessive embellishments that can distract from the data. Aim for a clean and clear design where the data takes center stage.
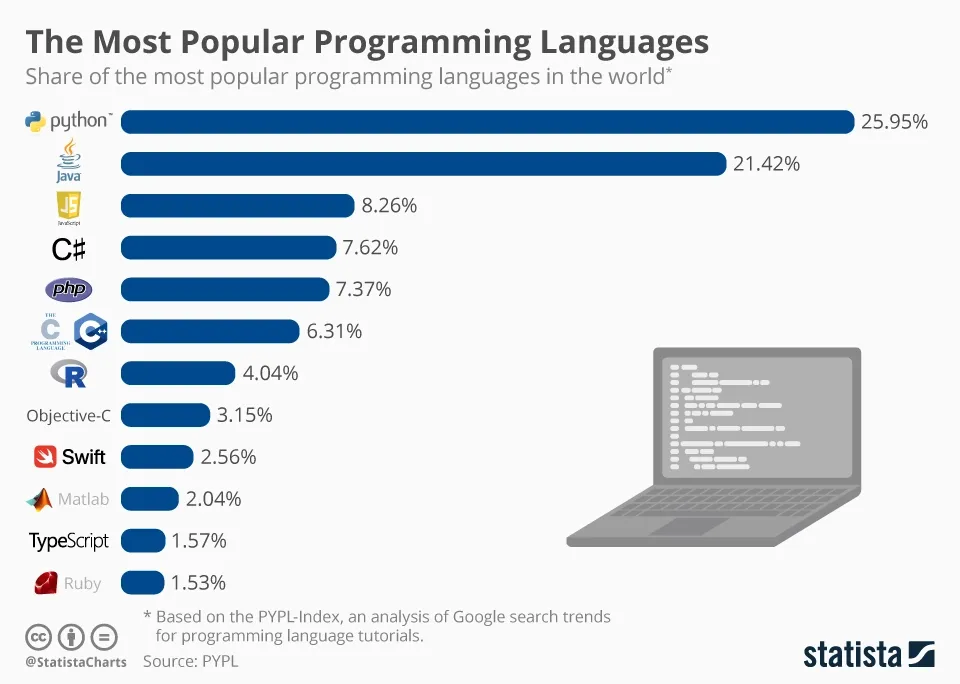
- Context: Data devoid of context can lead to misinterpretation. Always provide relevant context to help your audience understand the data. This can be achieved through clear labels, appropriate scales, meaningful titles, and concise descriptions.
- Consistency: Consistency in using colors, shapes, and patterns across your visualization is crucial in avoiding confusion. For instance, if you use blue to represent a specific category in one part of your visualization, maintain the same color code throughout.
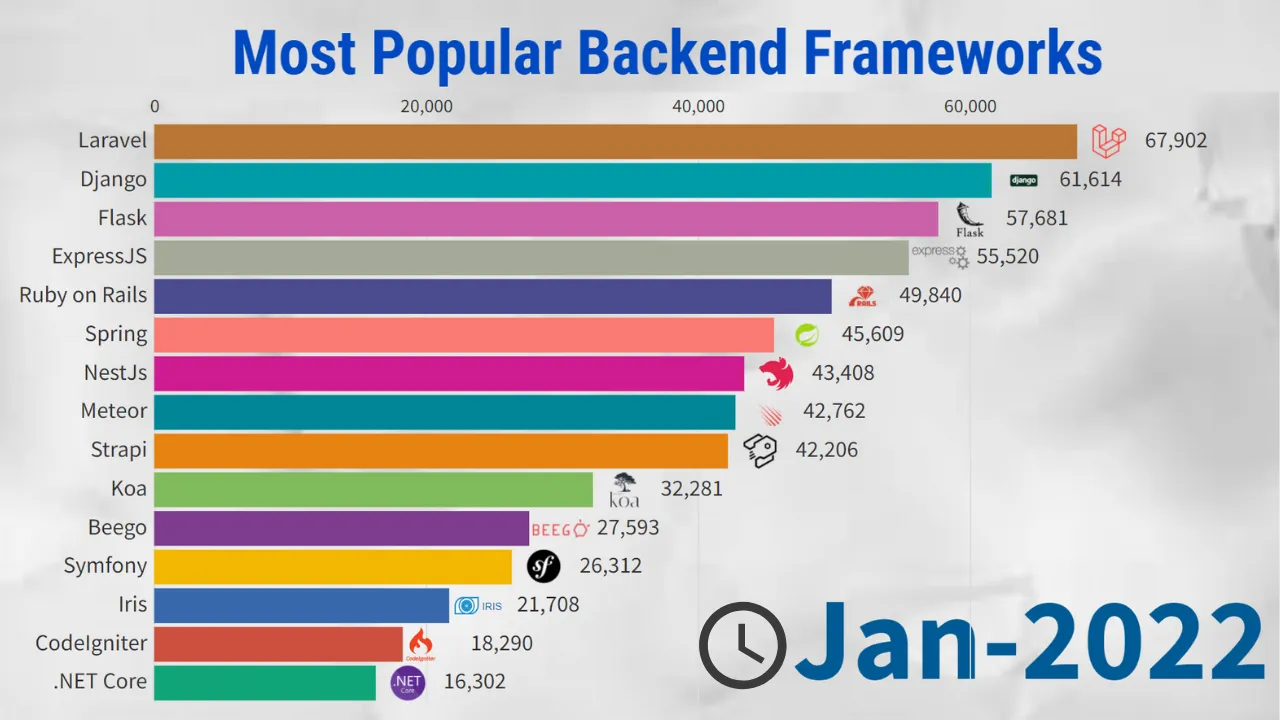
- Customization: Tailor your visualization to your audience. A detailed and complex visualization may work well for data scientists but may overwhelm a non-technical audience. Understand who you are communicating with and adapt your visualization accordingly.

- Interactivity: Leveraging interactive elements in your visualization can significantly enhance engagement. It allows users to explore the data at their own pace and according to their interests.
Conclusion
Data visualization stands at the intersection of technology, design, and storytelling. It transforms abstract data into accessible insights, helping us navigate and make sense of our complex data-driven world. As the volume of data continues to grow, the importance of effective data visualization cannot be overstated. These skills are no longer mere 'nice-to-haves' but essential capabilities for anyone working with data.
In our upcoming blog post, we will delve deeper into the best practices for data visualization, discussing the most effective techniques and tools for visually communicating your data insights. Stay tuned!
For those eager to start their journey with data visualization, don't forget to revisit our blog post on "Data visualization in Python, Part 1: Cellular Automata".
This blog post, authored by Aleksander Kawala, is primarily a tutorial on using Python for data visualization, specifically on simulating cellular automata. The author shares his journey of learning Python, explaining how he used a practical project - simulating the propagation of a sound wave - to gain deeper insights into the language and its libraries.
The tutorial steps through creating an initial visualization with Matplotlib, a popular Python library for data visualization. It then delves into customizing the plot and simulating the sound wave using code snippets. It demonstrates concepts like pressure calculations, outflow rates, animations, and even simulating a soundproof wall in the environment.
Towards the end, the author discusses optimizing the code, recording the animation as a video, and further customizing the plot. He also mentions plans for future work, including adding the capability to draw walls in a graphics editor.
TL;DR
- The article discusses the critical role of data visualization in making complex data insights accessible and understandable.
- Data visualization can transform abstract data into engaging visuals, enhancing its accessibility and promoting better understanding.
- The post provides strategies for effective data visualization: Clarity: Keep the design simple and focused on the data Context: Provide relevant information to help understand the data better. Consistency: Maintain uniform use of colors, shapes, and patterns. Customization: Adapt your visualization to the needs of your audience. Interactivity: Use interactive elements to enhance user engagement.
An upcoming blog post will delve deeper into the best practices, techniques, and tools for effective data visualization.
For those keen to start with data visualization, the previous blog post on "Data Visualization in Python, Part 1: Cellular Automata" can be revisited.
We are here to assist if you need professional help with data visualization or any Python-related tasks. Contact us today to leverage our expertise and transform your data into insightful visuals.
