Patryk Młynarek
6 February 2024, 8 min read

What's inside
- Key features
- Why Dash Enterprise Stands Out
- Minimal working examples
- Final thoughts
- Conclusion
- Your Next Step: Contact Us
Welcome back! In Part 1, I’ve explained the core functionalities and differences between Streamlit, Dash, and Panel. We’ve explored the basic features, compared their popularity, and set the stage for more in-depth discussion.
Now, in Part 2, I’ll dive deeper. If you want more details to make an informed decision, you’re in the right place. Here, I’ll cover the unique features that set these frameworks apart, how they cater to enterprise needs, and what to consider when it comes to deploying your web apps.
Note: Prefer to get hands-on with the code immediately? You can find a fully working example in our GitHub repository.
Key features
Ease of Use
Streamlit shines in its simplicity, requiring minimal code to turn data scripts into applications. Dash provides more customization options, while Panel offers flexibility in terms of library integration.
Interactivity
Streamlit, Dash, and Panel excel in creating highly interactive applications with features like real-time updates, interactive widgets, and responsive layouts.
Visualization
Streamlit and Dash are built around visualization, with Dash offering sophisticated data visualization capabilities through Plotly. Panel's integration with multiple visualization libraries allows for diverse charting options.
Customization
Dash and Panel provide more customization options compared to Streamlit. Dash’s reactive components and Panel’s declarative syntax enable developers to fine-tune their applications.
Deployment
All three technologies support deployment on various platforms, including cloud services and servers. Streamlit also offers sharing solutions/hosting on author’s platforms. Dash's enterprise version includes a user-friendly app manager to simplify app deployment.
Let's delve into the specifics of how each of these three technologies approaches deployment across different platforms.
Streamlit
- Streamlit Sharing: This is perhaps the simplest way to deploy a Streamlit app designed specifically for this framework. With a click of a button within the Streamlit UI, you can make your app public on a custom URL.
- Cloud Platforms: Streamlit apps can be easily deployed on popular cloud services like AWS, Azure, and Google Cloud.
- Streamlit in Snowflake: Streamlit is now seamlessly integrated into Snowflake, offering users a unified ecosystem for data analytics and application development.
- Docker: Streamlit is containerization-friendly. You can wrap your app in a Docker container and deploy it virtually anywhere.
- Own Servers: You can deploy on your servers if you require more control over your data and infrastructure.
Dash
- Dash Enterprise: This end-to-end platform is designed for Dash apps, offering features like a user-friendly app manager for easy deployment and scaling.
- Cloud Services: Dash apps can be deployed on AWS, Azure, and Google Cloud, similar to Streamlit.
- Heroku: Given its ties to Python, Dash apps can be deployed straightforwardly on Heroku. The transition to Dash Enterprise is smooth, especially if you're already using Heroku.
- Docker: Like Streamlit, Dash apps can also be containerized using Docker, offering flexibility in deployment options.
- dash.testing: Dash offers a dedicated package for web app testing, including Unit Tests, Mocking Callback Context, End-to-End Tests, and more. Importantly, Dash provides a documentation testing section.
Panel
- Cloud Platforms: Panel is cloud-agnostic and can be deployed across all major cloud platforms, including AWS, Azure, and Google Cloud.
- On-Premise Servers: With more stringent data policies, Panel apps can also be deployed on your hardware.
- Python Web Servers: Panel apps like Flask can run on most Python web servers, making it a flexible choice for many backend systems.
- Docker and Kubernetes: Panel is compatible with Docker for containerization and can be orchestrated using Kubernetes if looking at large-scale, distributed deployments.
Enterprise features
- Single Sign-On (SSO): Dash Enterprise offers robust SSO capabilities, ensuring secure access and authentication for enterprise users.
- Self-Hosting: Streamlit and Dash provide options to quickly deploy the applications via the app manager.
- Snowflake Integration: Streamlit has gained attention for integrating with Snowflake, a cloud-based data warehousing platform. It allows users to embed Streamlit apps directly within Snowflake dashboards, enhancing data accessibility and presentation.
Dash Enterprise also offers built-in integration with Snowflake, providing users with versatile options for creating impactful data-driven applications.
Streamlit, Dash and Panel can be also integrated with Snowflake programmatically with custom solutions.
| Features/Frameworks | Streamlit | Dash | Panel |
|---|---|---|---|
| Ease of Use | High (Minimal code) | Medium (Customizable) | Medium (Flexible) |
| Interactivity | Excellent | Excellent | Excellent |
| Visualization | Strong | Strong (via Plotly) | Diverse |
| Customization | Limited | High | High |
| Deployment | Cloud, Own server | Cloud, Own Server | Cloud, Own server |
| Enterprise Features | Integration with Snowflake | SSO, Self-hosting and more | Not applicable |
| Snowflake Integration | Yes | Yes | Yes, custom |
| Community Support | High (26.9k stars) | High (19.3k stars) | Moderate (3.1k stars) |
Legend:
Key to Ratings:
- Ease of Use: High/Medium/Low ease based on required code and learning curve.
- Interactivity: Describes the ability to engage with the application in real-time.
- Visualization: The capability of each framework to visualize data.
- Customization: Flexibility in terms of design and user interface.
- Deployment: The platforms where the application can be deployed.
- Authentication: Describes the methods of user verification available.
- Enterprise Features: Specific functionalities designed for large businesses.
- Snowflake Integration: Whether the framework has built-in support for Snowflake data warehousing.
- Community Support: Measured by the number of GitHub stars as a rough indicator of community adoption.
Why Dash Enterprise Stands Out
While Streamlit and Panel offer impressive features, Dash Enterprise takes it a step further with advanced capabilities designed for scalability, security, and complex data processing.
These exclusive features include:
- App Manager - Deploy, share, and manage your Dash apps.
- Kubernetes - Horizontal scaling & zero downtime deployment.
- No-code Authentication - Login to Dash apps with SSO SAML, AD, LDAP & more.
- Job Queue - Queueing is key to building scalable ML apps.
- Design Kit - Professional grade styling & branding.
- Snapshot Engine - Create, archive & share Dash app views as links.
- Reporting - Programmatically generate pixel-perfect PDFs & reports.
- Dashboard Toolkit - Drag & drop, crossfilter & chart editing for Dash apps.
- Embedding - Embed Dash apps inside web apps or Salesforce
- ML & AI Templates - Copy-paste Dash templates for PyTorch, Tensorflow, Keras, etc.
- User Analytics - Built-in user database & usage dashboard.
- High Performance Computing - Parallelize your Python code or run in GPU memory.
- Data Science Workspaces - Write Dash & Jupyter code in the Workspaces editor.
- Big Data Pipelines - Connect Dash apps to Databricks, Snowflake, Dask, and more.
These features are unavailable(or not out of the box) in Streamlit and Panel, making Dash Enterprise the go-to choice for businesses requiring advanced functionalities.
Minimal working examples
Streamlit

app.py
import time
import numpy as np
import pandas as pd
import streamlit as st


DATE_COLUMN = "date/time"
DATA_URL = "https://s3-us-west-2.amazonaws.com/streamlit-demo-data/uber-raw-data-sep14.csv.gz"


@st.cache_data
def load_data(nrows):
    data = pd.read_csv(DATA_URL, nrows=nrows)
    lowercase = lambda x: str(x).lower()
    data.rename(lowercase, axis="columns", inplace=True)
    data[DATE_COLUMN] = pd.to_datetime(data[DATE_COLUMN])
    return data


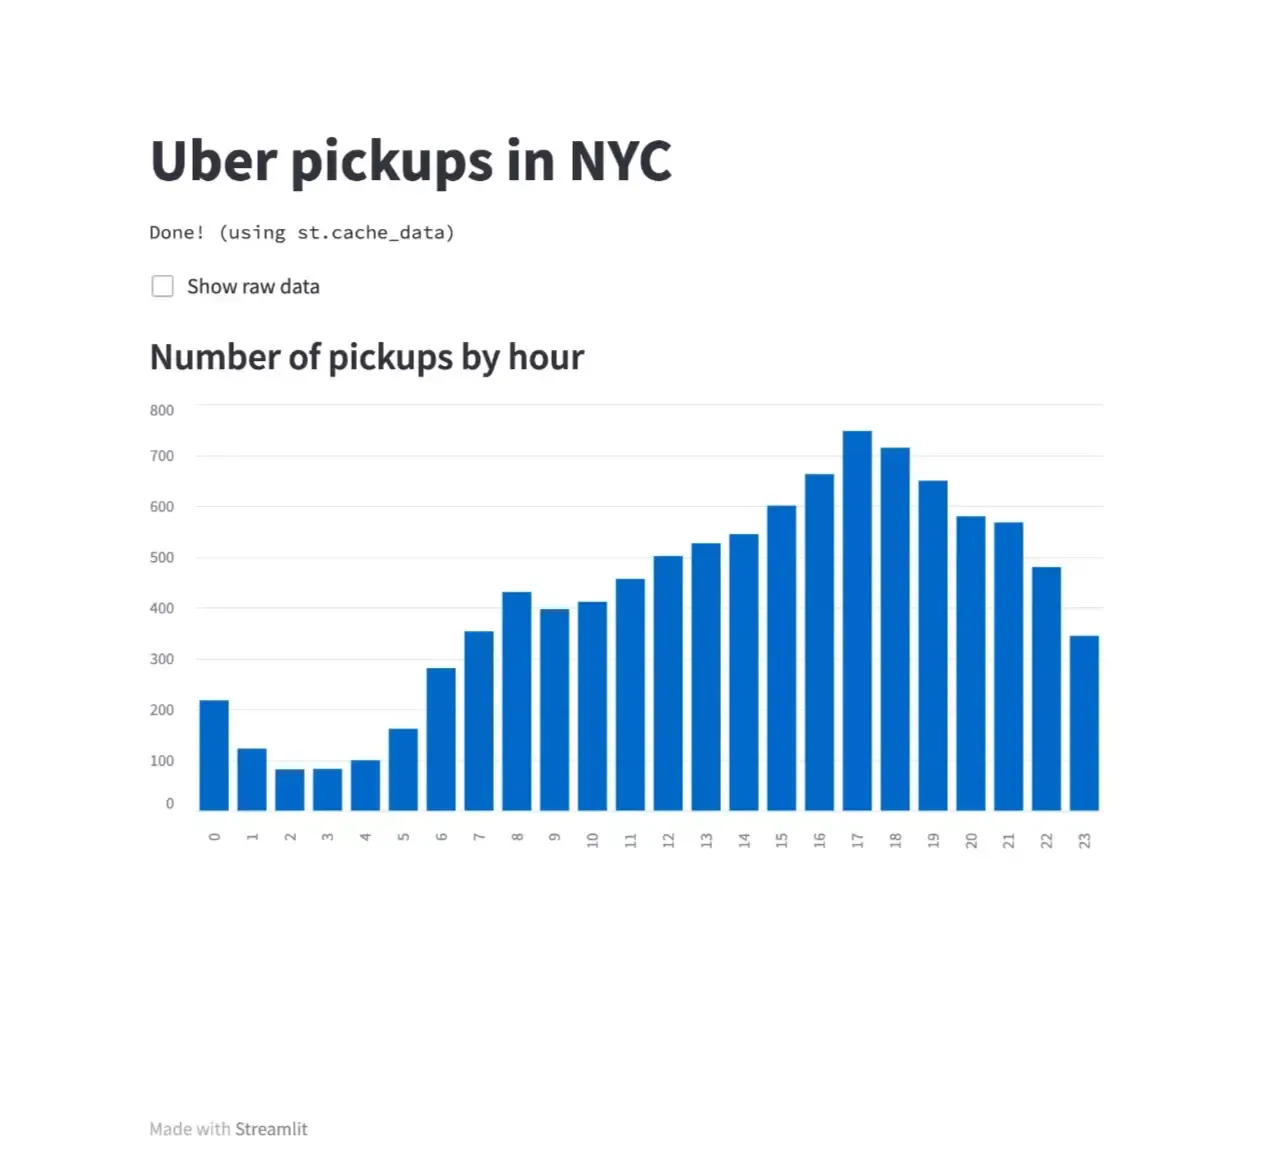
st.title("Uber pickups in NYC")

data_load_state = st.text("Loading data...")
data: pd.DataFrame = load_data(10000)
data_load_state.text("Done! (using st.cache_data)")

if st.checkbox("Show raw data"):
    st.subheader("Raw data")
    st.write(data)

st.subheader("Number of pickups by hour")

hist_values: np.ndarray = np.histogram(data[DATE_COLUMN].dt.hour, bins=24, range=(0, 24))[0]
st.bar_chart(hist_values)
Command to run script: streamlit run app.py
Dash

app.py
import pandas as pd
import plotly.express as px
from dash import Dash
from dash import Input
from dash import Output
from dash import callback
from dash import dcc
from dash import html

df: pd.DataFrame = pd.read_csv("https://raw.githubusercontent.com/plotly/datasets/master/gapminder_unfiltered.csv")

app: Dash = Dash(__name__)

app.layout = html.Div(
    [
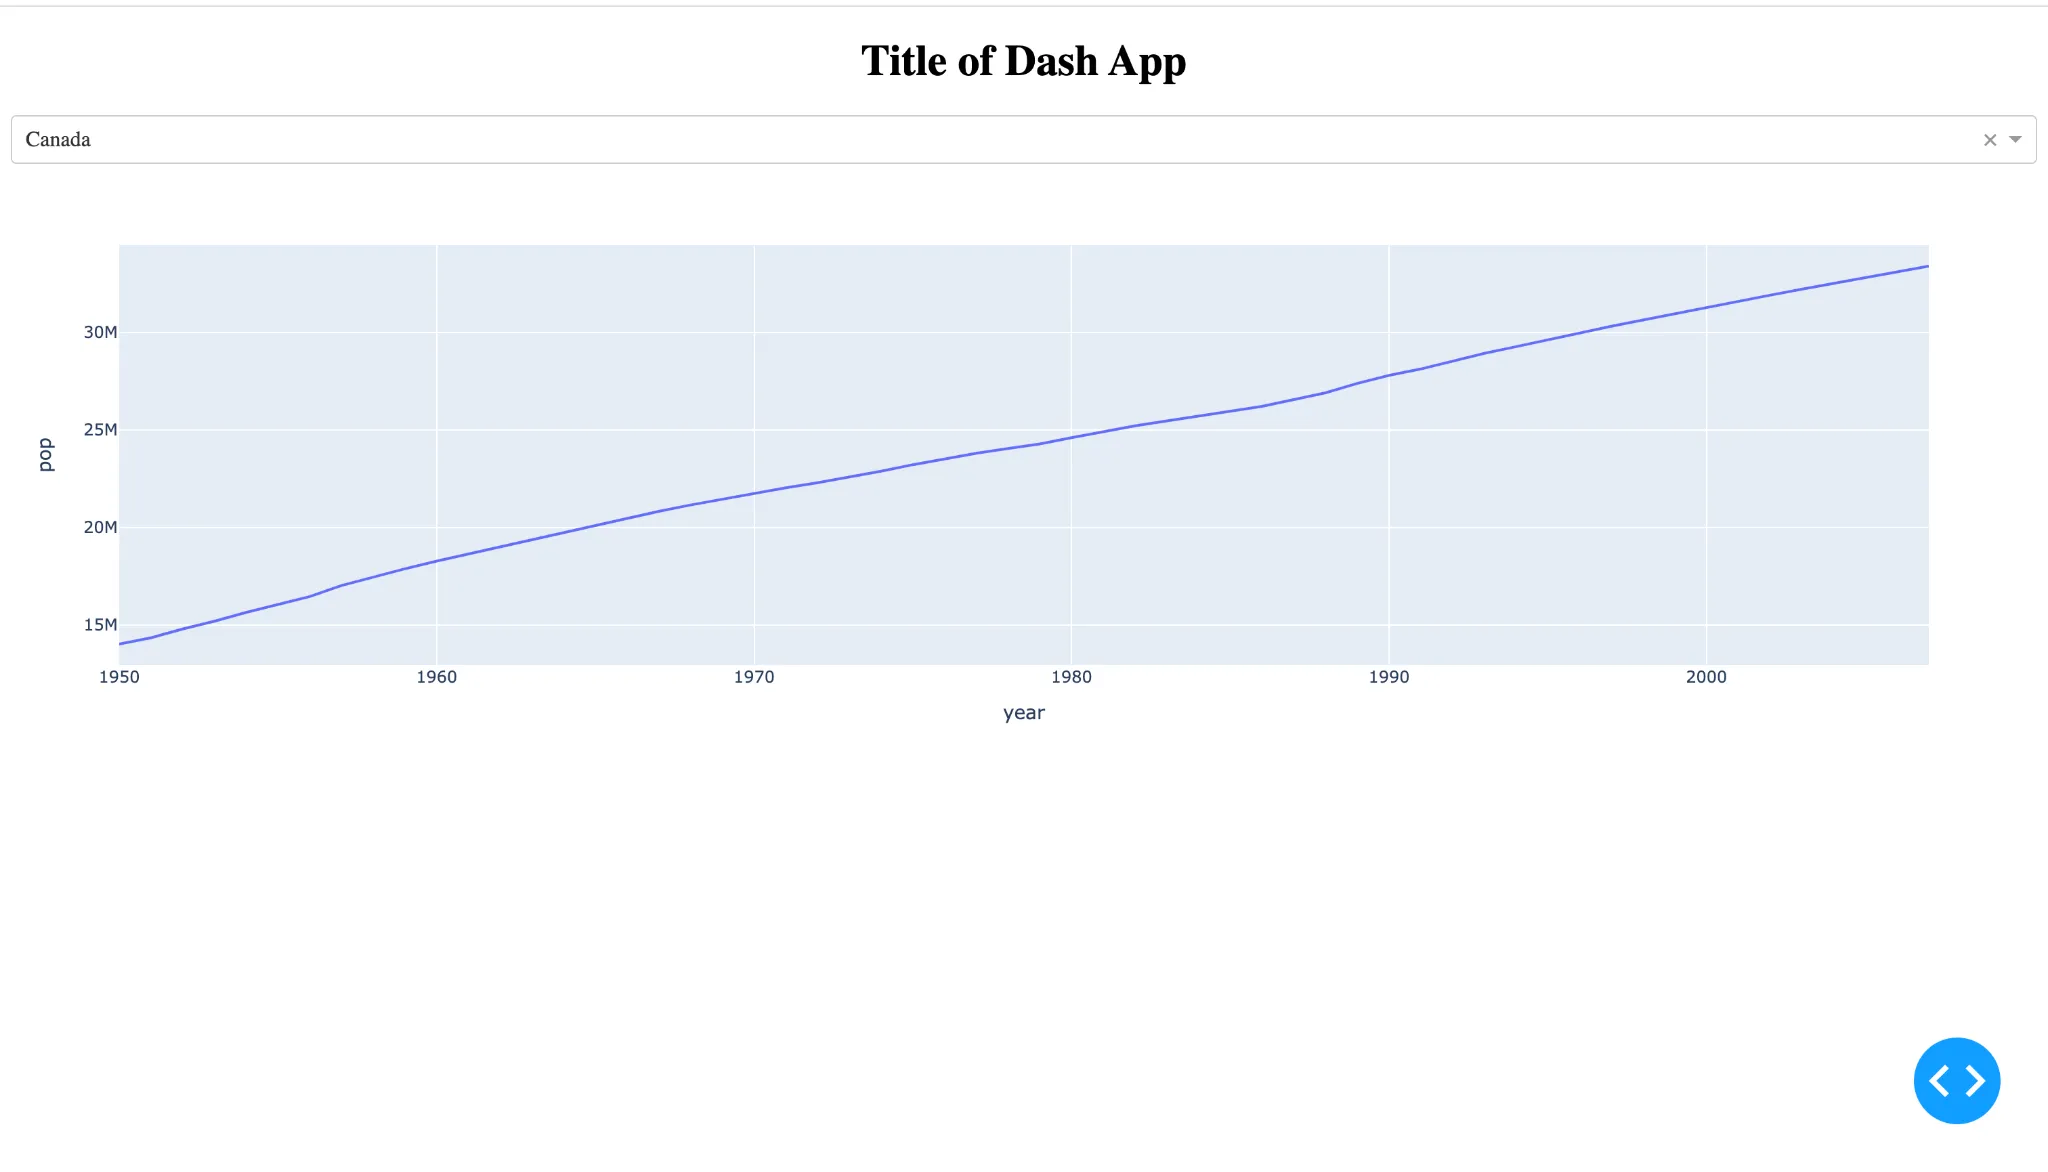
        html.H1(children="Title of Dash App", style={"textAlign": "center"}),
        dcc.Dropdown(df.country.unique(), "Canada", id="dropdown-selection"),
        dcc.Graph(id="graph-content"),
    ]
)


@callback(Output("graph-content", "figure"), Input("dropdown-selection", "value"))
def update_graph(value):
    dff: pd.DataFrame = df[df.country == value]
    return px.line(dff, x="year", y="pop")


if __name__ == "__main__":
    app.run(debug=True, host="0.0.0.0")
Command to run script: python app.py
Panel

app.py
import hvplot.pandas
import numpy as np
import pandas as pd
import panel as pn

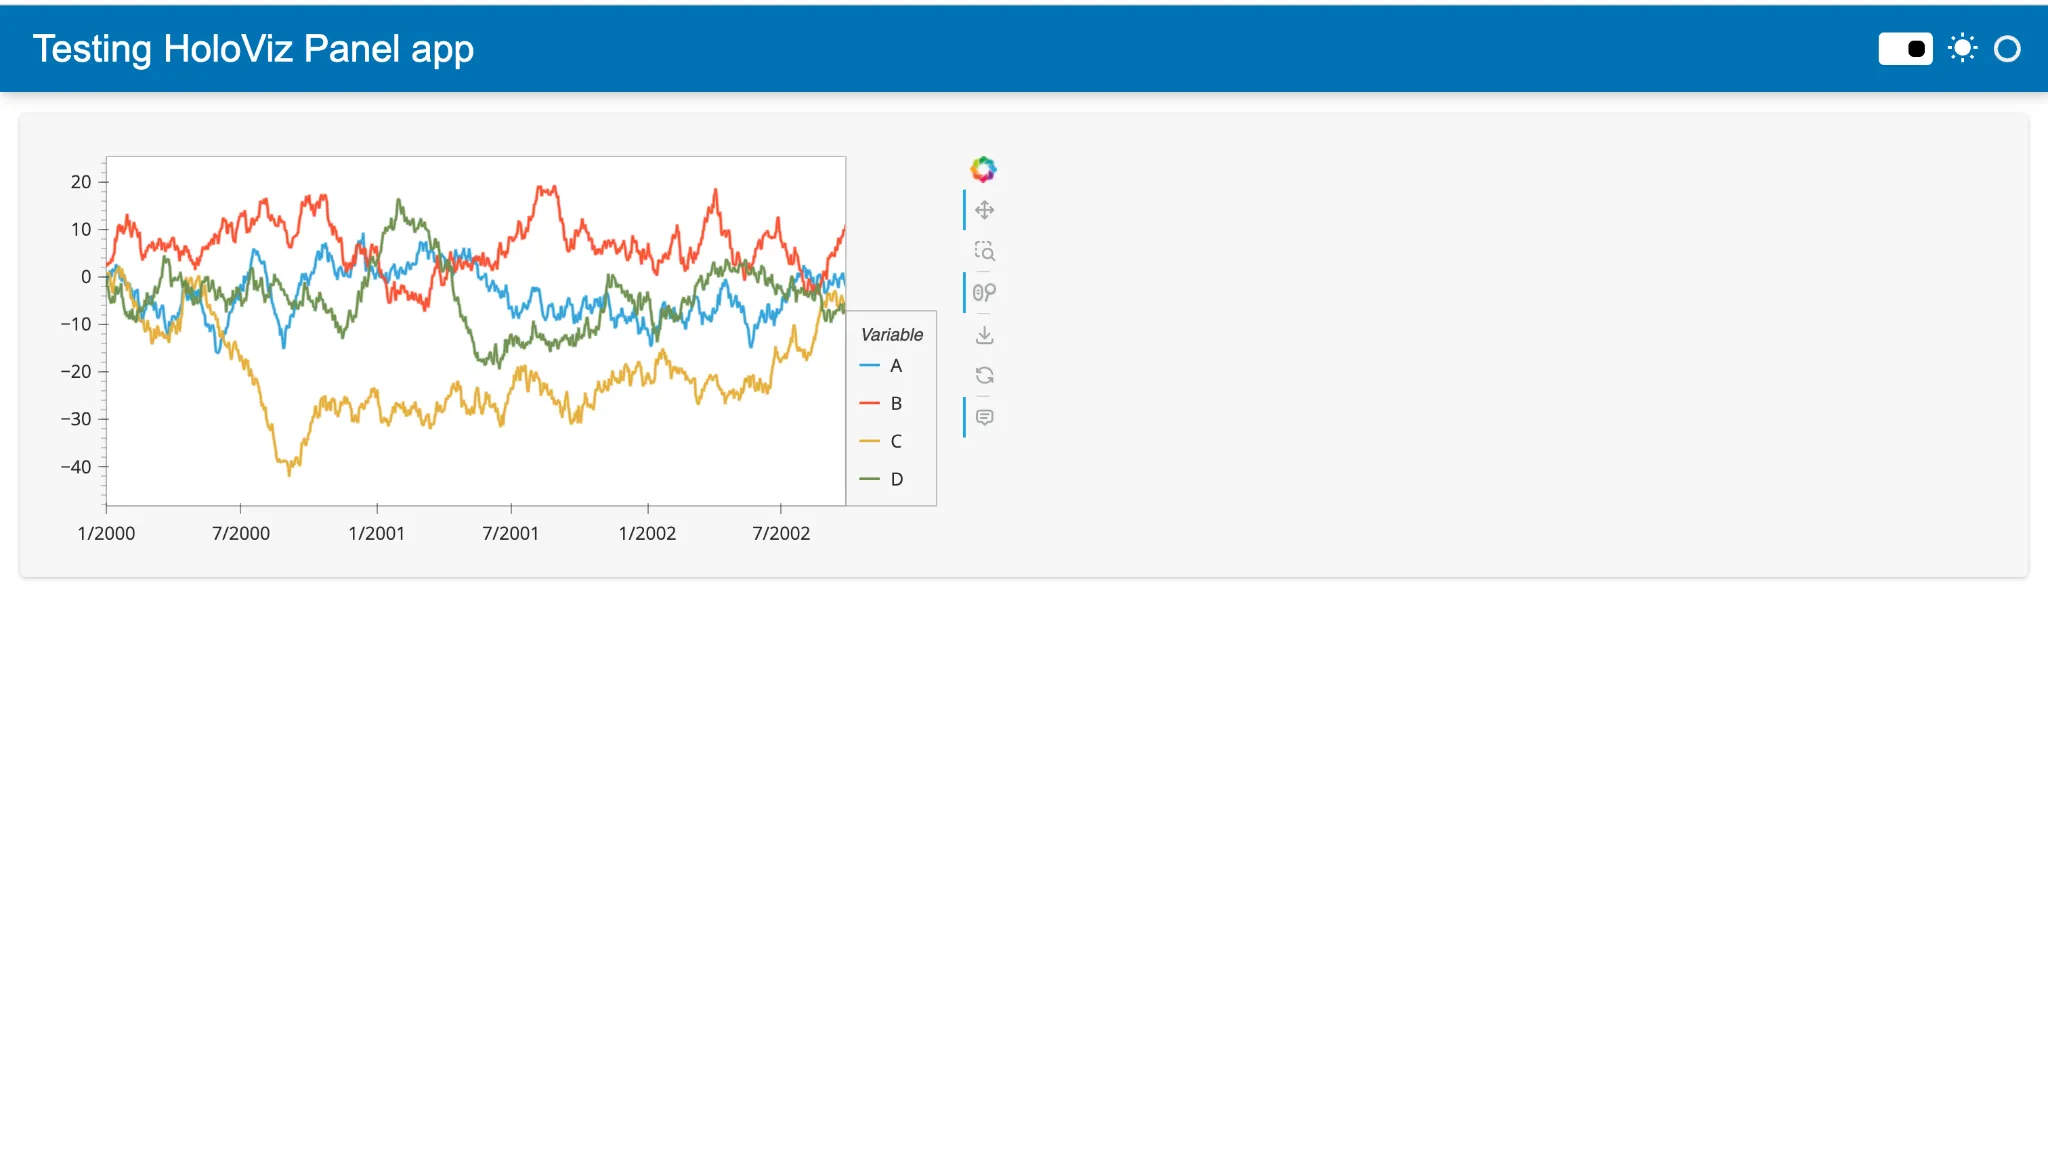
idx = pd.date_range("1/1/2000", periods=1000)
df = pd.DataFrame(np.random.randn(1000, 4), index=idx, columns=list("ABCD")).cumsum()

pn.template.FastListTemplate(
    title="Testing HoloViz Panel app",
    main=[
        df.hvplot(),
    ],
).servable()
Command to run the script: panel serve app.py --autoreload --show
You can explore a more comprehensive example by visiting our GitHub repository.
This sample project incorporates all three mentioned technologies, and it's built to run seamlessly on Docker. To get started, simply execute the 'make up' command (for additional instructions, please refer to the README).
As a bonus, you can also see how to create and run end to end (e2e) tests against such applications, using the Playwright framework.
Final thoughts
My thoughts on these three technologies in simpler language:
- Streamlit: Streamlit is super easy to use, looks nice, and lets you code quickly. Its documentation is great.
- Dash: Dash is also easy to use but a bit more complicated than Streamlit. It's more powerful if you know how to use it, and it has excellent documentation.
- Panel: Panel is flexible and powerful, but its documentation isn't as good as Streamlit and Dash. The components in Panel might not look as nice by default.
If I had to pick one for a business project, I'd go with Dash or Streamlit. They're more popular, have better documentation, are easier to work with, and have prettier default widgets, making them look more polished.
Conclusion
In this comprehensive guide, I've dissected the intricacies of three major players in the data visualization and web application sphere—Streamlit, Dash, and Panel.
Each of these frameworks brings its unique set of features, capabilities, and community support to the table, making the choice of a suitable tool largely dependent on your specific needs and expertise.
Choosing the right tool could be the key to not just making your data understandable but also making it tell a compelling story.
Whether you're a startup looking for a quick way to showcase data or an enterprise aiming to build a robust data application, Streamlit, Dash, and Panel offer options that can be tailored to meet your objectives.
For those interested in diving deeper, don't forget to check out our related blog posts on various aspects of data visualization in Python.
Go Back to Data Viz with Streamlit, Dash, and Panel, Part 1.
Happy coding!
Your Next Step: Contact Us
If you found this guide beneficial and are looking for more tailored solutions, don't hesitate to contact Sunscrapers. With our expertise in data visualization technologies and solutions, we can help you select the right tool for your business needs and assist in deploying effective, scalable data applications.
Click here to contact us and take your data storytelling to the next level.
What You'll Get By Contacting Us:
- Expert Consultation on Data Visualization Tools
- Tailored Solutions for Your Business
- Quick and Scalable Data Application Deployment
If you’re interested in how these tailored solutions might look, feel free to browse through our GitHub repository for examples.


